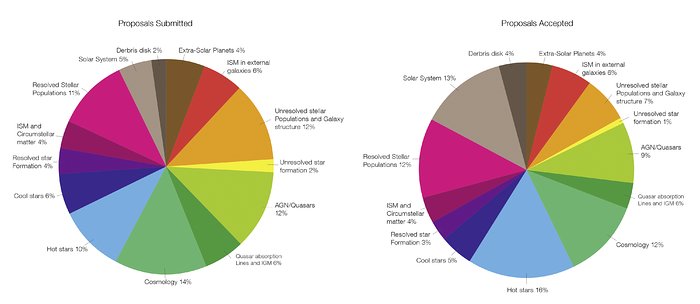
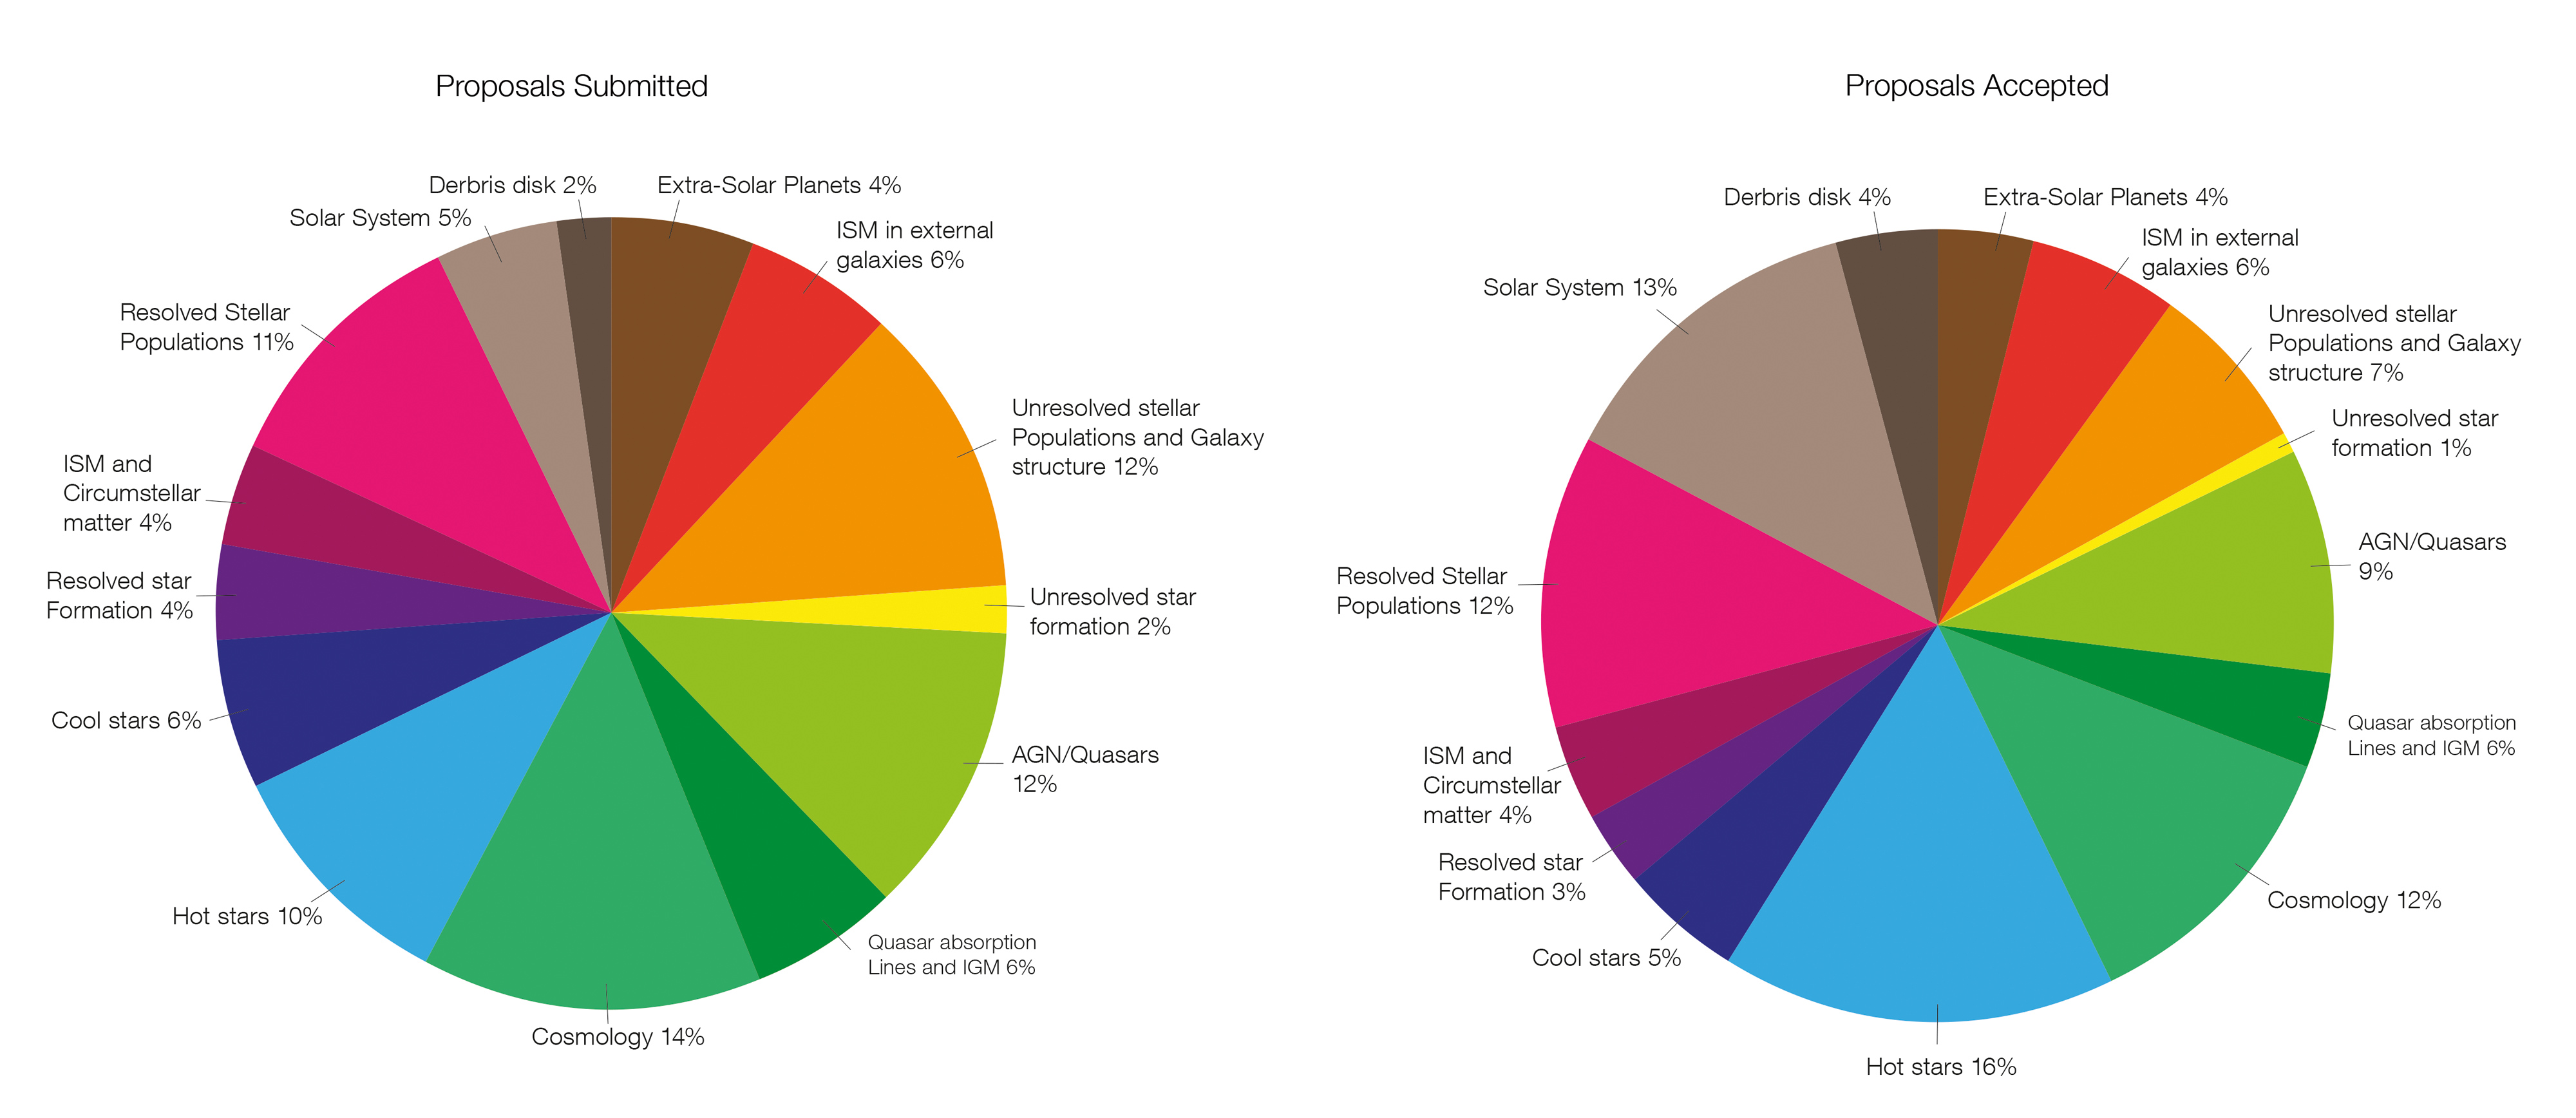
Comparison of the distribution of scientific topics for submitted and accepted proposals for the cycle 22 TAC
This figure compares the submitted and accepted proposals, divided by their scientific topic, submitted for Cycle 22. On the left is a chart showing the distribution of scientific topics for the submitted proposals and on the right is a chart showing the distribution of scientific topics for the accepted proposals.
These proposals were discussed and ranked at the time allocation committee in June 2014.
Credit:About the Image
| Id: | sci14009a |
| Type: | Artwork |
| Release date: | 29 July 2014, 15:45 |
| Related science announcements: | sci14009 |
| Size: | 4961 x 2153 px |
About the Object
| Type: | Unspecified |
| Category: | Miscellaneous |